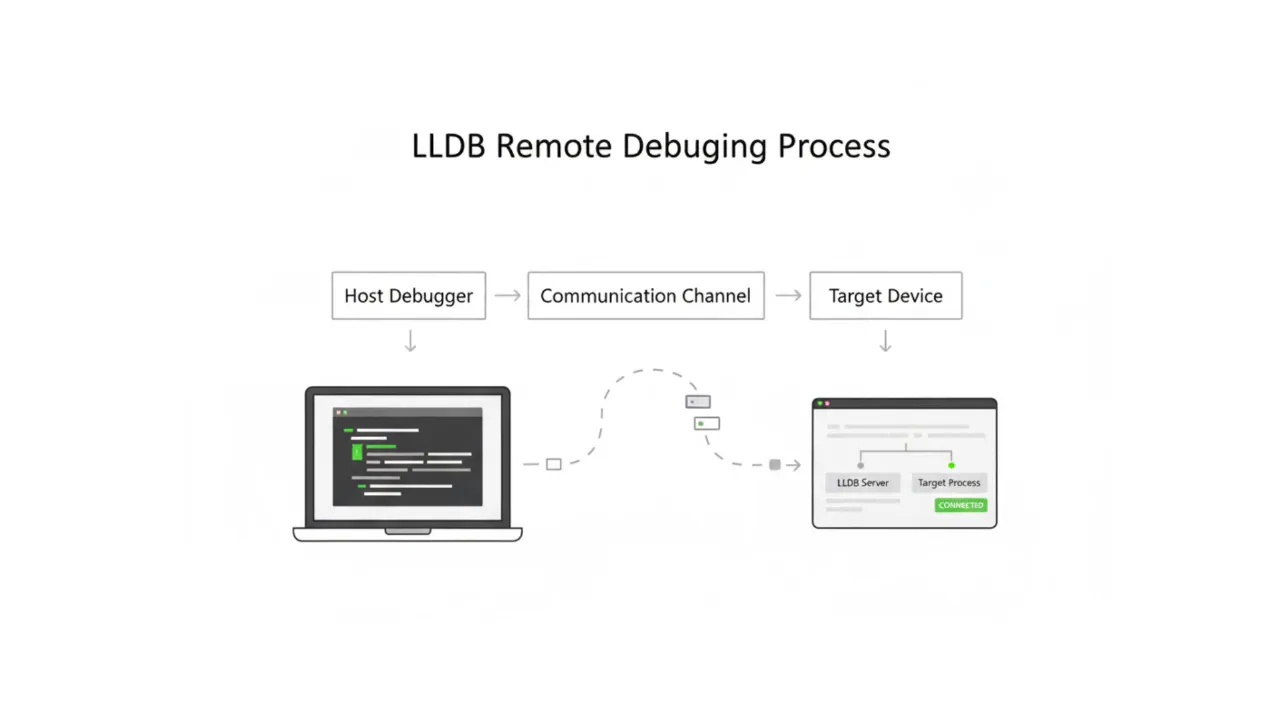
Remote debugging is a critical capability that enables developers to debug code on a target device without running the debugger directly on that device. This guide demonstrates how to utilize lldb and lldb-server to implement effective remote debugging workflows.
Why Remote Debugging?
In scenarios such as embedded systems development and remote server maintenance, the target device often has limited resources or lacks a complete development environment. Remote debugging allows developers to run the heavy-lifting debugger on a local machine while connecting to a lightweight debug server on the remote device, ensuring an efficient and minimally intrusive debugging process.
What are LLDB and lldb-server?
LLDB is the debugger for the LLVM project, supporting multiple programming languages and platforms. lldb-server is a component of LLDB that functions as a remote debugging server, allowing LLDB clients to connect to and control remote processes. The relationship between LLDB and lldb-server parallels that of GDB and gdbserver. However, LLDB offers superior platform-specific capabilities. Unlike GDB, which delegates most platform interaction to gdbserver, LLDB’s SBPlatform abstraction object provides robust management of remote file systems, processes, and environments. This highlights the architectural advantages of LLDB:
- Remote File and Path Mapping: LLDB’s
SBPlatformnatively understands how to access the target machine’s file system vialldb-server. This is critical for handling Sysroots, shared libraries, symbol file discovery, and source code path mapping. GDB relies more heavily on local files or manual configuration. For instance, in LLDB, a Module’s path serves merely as an identifier; its reachability and access method are semantically defined entirely by the Platform. - Granular Remote Process Control:
SBPlatformis not solely responsible for launching processes; it manages the entire remote environment setup, including environment variables and working directories. - Source of Truth: Remote (LLDB) vs. Local (GDB): LLDB leverages
SBPlatformto collaborate withlldb-server, intelligently locating dependent system libraries (Sysroot) on the remote target and loading their corresponding symbols onto the host. - Extensibility: The platform layer is highly extensible, allowing developers to write custom platform adapters for new operating systems or embedded environments.
SBPlatform?
SBPlatform is a key abstraction layer in the LLDB architecture. It serves as an adapter and interface between the core debugging engine and the target operating system or execution environment. It is responsible for handling all platform-related tasks, such as process launching and management, file system access, and network communication with lldb-server during remote debugging. By abstracting these low-level details, SBPlatform ensures that LLDB’s core debugging logic remains generic and independent of the specific host or target environment, thereby enabling powerful cross-platform debugging capabilities.
1. Architecture Comparison
| Feature | GDB (gdbserver) | LLDB (lldb-server + SBPlatform) |
|---|---|---|
| Architecture Philosophy | Traditional Client/Server architecture; gdbserver has limited functionality, mainly handling register/memory read/write. | Modern componentized architecture; the Platform layer assumes full semantic control of the remote environment. |
| File System Access | Loose coupling. GDB often assumes symbol files are local; remote file reading capability is limited. | Strong coupling. The Platform knows how to efficiently access the remote file system via lldb-server. |
| Path Handling | Paths are usually treated as local file paths, requiring manual configuration of solib-search-path. | Paths are treated as abstract identifiers; the Platform determines resolution (local or remote). |
| Dependency Lookup | Uses Local as the source of truth. If the library is missing locally, debugging may fail. | Uses Remote as the source of truth. Can automatically discover remote dependencies and download/load symbols. |
| Extensibility | Primarily extended via Python scripts. | Core components (like Platform) are themselves pluggable, facilitating adaptation to new OSes. |
2. Remote Debugging Capabilities Comparison
| Feature | gdbserver | lldb-server (gdb-remote) | lldb-server (platform) |
|---|---|---|---|
| Cross-Architecture Debugging | ✔ | ✔ | ✔ |
| Remote Breakpoint / Stepping | ✔ | ✔ | ✔ |
| Remote Process Creation | ✖ | ✖ | ✔ (Can launch directly) |
| Remote File Transfer | ✖ | ✖ | ✔ (Supports put/get) |
| Platform Auto-Detection | ✖ | ✖ | ✔ (OS/SDK Version) |
Although LLDB is more modern and powerful than GDB, GDB still holds advantages when debugging bare metal and certain legacy platforms. Choosing the right tool is key to efficiency.
LLDB Command Line Debugging
1. Starting lldb-server on the Target Device
To initiate remote debugging, lldb-server must first be started on the device. Use the following command to start lldb-server in Platform mode:
lldb-server platform --server --listen "*:1234"
2. Connecting to lldb-server from the Local Machine
Launch lldb on the local machine and connect to the remote lldb-server:
lldb
(lldb) platform select remote-linux
(lldb) platform connect connect://<remote-ip>:1234
Upon a successful connection, information about the current remote platform will be displayed, for example:
(lldb) platform connect connect://192.168.139.113:1234
  Platform: remote-linux
    Triple: aarch64-unknown-linux-gnu
OS Version: 6.17.8 (6.17.8-orbstack-00308-g8f9c941121b1)
  Hostname: ubuntu-arm
 Connected: yes
WorkingDir: /home/hidka
    Kernel: #1 SMP PREEMPT Thu Nov 11 09:34:02 UTC 2025
Once connected, you can utilize various LLDB debugging commands. Notably, in Platform mode, you only need to use target create <local_executable_path> locally to load the target. Upon executing the run command, LLDB automatically uploads the executable to the remote device. If the target program already exists on the remote device, you can specify its location via the --remote-file <remote_path> parameter when creating the target, or directly use process attach to attach to a running remote process.
VSCode Configuration for LLDB Remote Debugging
1. Install lldb-dap Extension
The LLVM project offers Debug Adapter Protocol (DAP) support for VSCode. Install the lldb-dap extension from the VSCode Marketplace and ensure the lldb-dap binary (usually provided with the LLVM toolchain) is installed.
2. Configure launch.json
Add the remote debugging configuration to the VSCode debugging configuration file launch.json:
{
    "version": "0.2.0",
    "configurations": [
        {
            "type": "lldb-dap",
            "request": "launch",
            "name": "Debug",
            "program": "${workspaceFolder}/out/build/Debug/your_executable",
            "initCommands": [
                "platform select remote-linux",
                "platform connect connect://<remote-ip>:1234"
            ]
        }
    ]
}
Once configured, initiate the remote debugging session by clicking the debug button in VSCode. The official documentation for the lldb-dap extension details the meaning and usage of each parameter; referring to it for advanced configuration is recommended.
Real-World Case Study: Remote Debugging an Android HAL Module
Having understood the basic remote debugging configuration, let’s look at a practical case study involving an Android HAL (Hardware Abstraction Layer) program to demonstrate how to use LLDB in a complex development environment.
When developing Android HAL modules, given the massive AOSP codebase and complex system environments, developers typically rely on high-performance remote servers for code compilation and builds. Therefore, the typical project environment for this scenario is as follows:
- Remote Server: The remote development machine hosting the AOSP environment, responsible for compiling and building the code; equipped with ADB and LLDB.
- Local Machine: The developer’s personal workstation, equipped with ADB and VSCode.
- Android Test Device: The physical device running the HAL program.
Pain Points & Solutions:
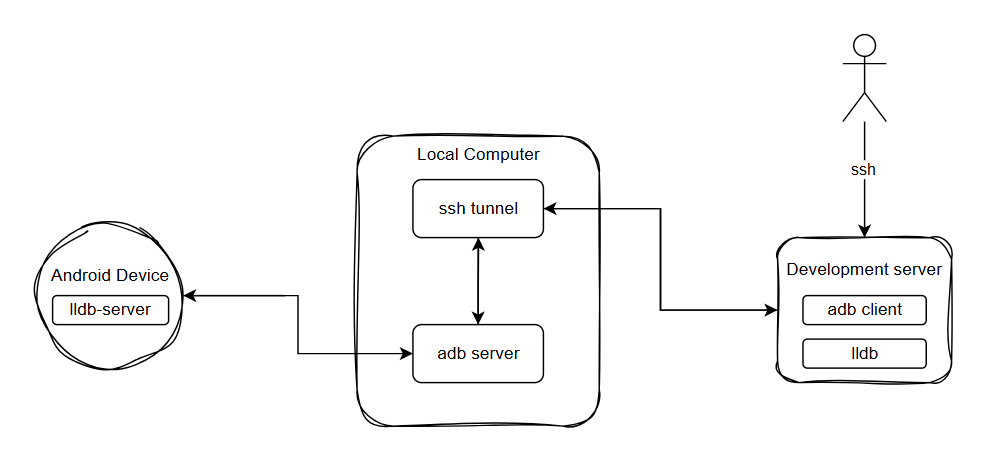
Since the source code and build artifacts reside on the remote server (often a shared machine), downloading massive unstripped dynamic libraries or executables to the local machine for debugging is highly inefficient. To circumvent this, we can leverage ADB’s Client/Server architecture and SSH port forwarding to use the Local Machine as an intermediary bridge, establishing a direct debugging pipeline between the Remote Server and the Android Test Device.
1. Environment Setup & Network Routing
- Remote Server Setup:
As developers usually lack Root privileges on shared development servers, it is recommended to usecondato create an isolated virtual environment. This allows you to install the latest LLDB and ADB toolchains without polluting the host’s base system. You can configure this via the following terminal commands:# Create and activate a conda environment conda create -n debug_env conda activate debug_env # Install LLDB and ADB tools using the conda-forge channel conda install -c conda-forge lldb android-tools - Local Machine Setup (SSH Forwarding):
Install and start the ADB service on the local machine. Next, configure SSH reverse port forwarding to map the local ADB Server port (default5037) back to the remote server. By doing this, runningadb deviceson the remote server routes the request through the SSH tunnel, seamlessly discovering the Android devices physically connected to your local machine.
Besides the ADB port, you must also forward thelldb-serverdebug ports via SSH. Note: In LLDB’s Platform mode, the control port and data port are separated. Therefore, you need to forward both the port handling command interactions and the ports actively transmitting debug data. - Android Device Setup:
Push thelldb-serverbinary (provided within the Android NDK) to the device and execute it. To preventlldb-serverfrom allocating random data ports—which would invalidate our static SSH forwarding configuration—you must explicitly constrain the port range upon startup:# Execute natively in the Android device shell ./lldb-server platform --server --listen "*:7878" --min-gdbserver-port=17879 --max-gdbserver-port=17880
2. Build Artifacts & Source Mapping
- Separation of Symbol Files and Executables:
When compiling HAL programs inside an AOSP environment, the build system typically outputs two versions: a stripped executable (or dynamic library) absent of symbols, and an unstripped version retaining full debugging symbols. To guarantee strict parity between testing and production environments, you must push the stripped program to the device for execution, while loading the unstripped program in the LLDB client to resolve source code. This practice is usually paired with theattachdebugging mode. - Build-ID Based Artifact Matching:
This highlights a core feature of LLDB’s remote debugging: when linking a remote process to local symbol files, LLDB does not solely rely on filenames. Instead, it extracts the internal Build ID (e.g., the GNU Build ID in ELF files) of the binary to verify precisely if they share the identical compiled artifact signature. Upon attaching to a remote process, LLDB extracts the Build IDs of modules loaded in the remote memory:- If it discovers a file harboring a matching Build ID within your specified local paths, LLDB instantly maps this local symbol file, enabling perfect source code evaluation.
- If the corresponding Build ID is absent locally, LLDB automatically falls back to fetching and downloading the running (stripped) binary directly from the device’s memory to the local host. As this retrieved file inherently lacks a symbol table, you will only observe raw assembly instructions during debugging.
- Source Path Mapping (Source Mapping):
Once the comprehensive symbol table correlates via the Build ID, you might still encounter inaccessible source code. Because compilation natively happens within the remote AOSP environment, the baked-in source paths within the symbol tables (usually absolute paths to the remote AOSP server) will naturally misalign with the paths inside your local VSCode workspace. To remedy this, you must define asourceMapin your configuration to intercept and rewrite these path prefixes. If uncertain of the exact path formatting burned into your binaries, tools likestrings,objdump, orllvm-dwarfdumpcan extract this data from the unstripped target program.
3. VSCode Debugging Configuration & Pitfalls
Crucial Pitfall Warning:
Because we utilize SSH to manually proxy data ports, when initializing the platform select command within launch.json, you must exclusively choose remote-linux instead of remote-android! Under remote-android mode, LLDB automatically attempts to negotiate natively through ADB to randomize port forwarding, which forcefully disrupts our static SSH data port tunnels. Furthermore, if you encounter connection rejections after terminating a previous debugging session, this commonly stems from the device-side lldb-server failing to free its occupied data ports. Manually restarting the lldb-server on the device perfectly bypasses this issue.
Example launch.json Configuration:
{
    "version": "0.2.0",
    "configurations": [
        {
            "name": "Debug HAL Module",
            "type": "lldb-dap",
            "request": "attach",
            "program": "${workspaceFolder}/out/build/Debug/your_executable_with_symbols",
            "sourceMap": {
                "/absolute/path/recorded/during/remote/AOSP/build": "${workspaceFolder}"
            },
            "initCommands": [
                "shell adb forward tcp:7878 tcp:7878",
                "shell adb forward tcp:17879 tcp:17879",
                "shell adb forward tcp:17880 tcp:17880",
                "platform select remote-linux",
                "platform connect connect://localhost:7878"
            ],
            "preRunCommands": [
                "platform settings -w /vendor/bin/hw",
                "target modules search-paths add <device_library_path> <local_library_path>"
            ],
            "attachCommands": [
                "process attach --name your_executable --waitfor --include-existing"
            ],
            "timeout": 5,
            "preLaunchTask": "Start LLDB-Server"
        }
    ]
}
Example tasks.json Pre-Launch Task:
We can leverage a VSCode task to silently spawn lldb-server in the device’s background prior to executing the debugger.
{
    "version": "2.0.0",
    "tasks": [
        {
            "label": "Start LLDB-Server",
            "type": "shell",
            "command": "adb shell '/data/local/tmp/lldb-server platform --server --listen \"*:7878\" --min-gdbserver-port=17879 --max-gdbserver-port=17880 &' ",
            "presentation": {
                "reveal": "silent"
            }
        }
    ]
}
Common Issues and Solutions
1. Installation
- Linux: It is recommended to use the official llvm.sh script to install the latest version of the LLDB toolkit and Clang toolchain.
- Windows: Install via the official LLVM installer.
- Android: Utilize the Google-provided SDK toolchain, which includes
lldb-serverfor Android. - Embedded Devices: For embedded devices, consider cross-compiling
lldb-serverfor the target architecture.
2. Troubleshooting Connection Failures
Network and Firewall (Standard Linux Devices)
- Verify Port Accessibility: Ensure the target device’s firewall (e.g.,
iptables,ufw) allows inbound traffic on the portlldb-serveris listening on (default 1234). - Connectivity Testing: Use
telnet <ip> <port>ornc -zv <ip> <port>on the host machine to test connectivity. You can also usenmap -p <port> <ip>to scan the target port status.
Android Connection Mechanisms
Android debugging usually relies on ADB communication rather than direct TCP connections.
- Platform Selection: Use
platform select remote-android. - Connection Method:
- Unix Abstract Socket (Recommended): Start
lldb-serveron the device listening on a Unix Abstract Socket, and connect from the host usingplatform connect unix-abstract-connect://<socket_name>. In this case, LLDB will forward data internally via the ADB protocol without manually setting up port forwarding. - TCP Port: If listening on a TCP port, you can connect directly using
connect://localhost:<local>because LLDB will automatically executeadb forward.
- Unix Abstract Socket (Recommended): Start
Restricted Environments (Air-gapped/Closed Ports)
For devices that cannot be accessed directly via the network (e.g., high-security devices with only USB or serial connections):
- Port Forwarding: Establish a data channel between the host and the device. You can map the device’s debug interface to a local port (Localhost) on the host machine by writing tools or using existing tools (e.g., SSH Tunnel, USB mapping tools), and then connect LLDB to the local port.
- Serial Communication: If the device only has a serial connection, use tools like
socatto forward serial data to a local TCP port, and then connect LLDB to that port.
3. Version Mismatches
Significant version discrepancies between the LLDB client on the host and lldb-server on the target may lead to communication protocol incompatibilities, resulting in inexplicable packet error messages or connection interruptions.
- Recommendation: Strive to keep the versions on both ends consistent. If complete consistency is not possible, ensure Host Version >= Target Version.
4. Missing Symbols (Source Code/Stack Trace Unavailable)
If the connection is successful but bt only shows memory addresses, or source code cannot be viewed, it is usually because the host lacks the symbol files or system library copies (Sysroot) of the target machine.
- Set Sysroot:
(lldb) platform select remote-linux --sysroot /path/to/local/copy/of/target/rootfs - Manually Load Symbols:
(lldb) target modules add /path/to/local/symbol/file
5. Insufficient Permissions (Attach Failure)
When attaching to a running process on Linux/Android, you may encounter an Operation not permitted error. This is due to the kernel’s ptrace_scope security restriction.
- Solution:
Execute on the target machine:Or runecho 0 | sudo tee /proc/sys/kernel/yama/ptrace_scopelldb-serverdirectly withrootprivileges.
Conclusion
Remote debugging is a powerful tool that can greatly improve development and debugging efficiency. By flexibly using lldb and lldb-server, you can successfully carry out remote debugging work in various complex environments.